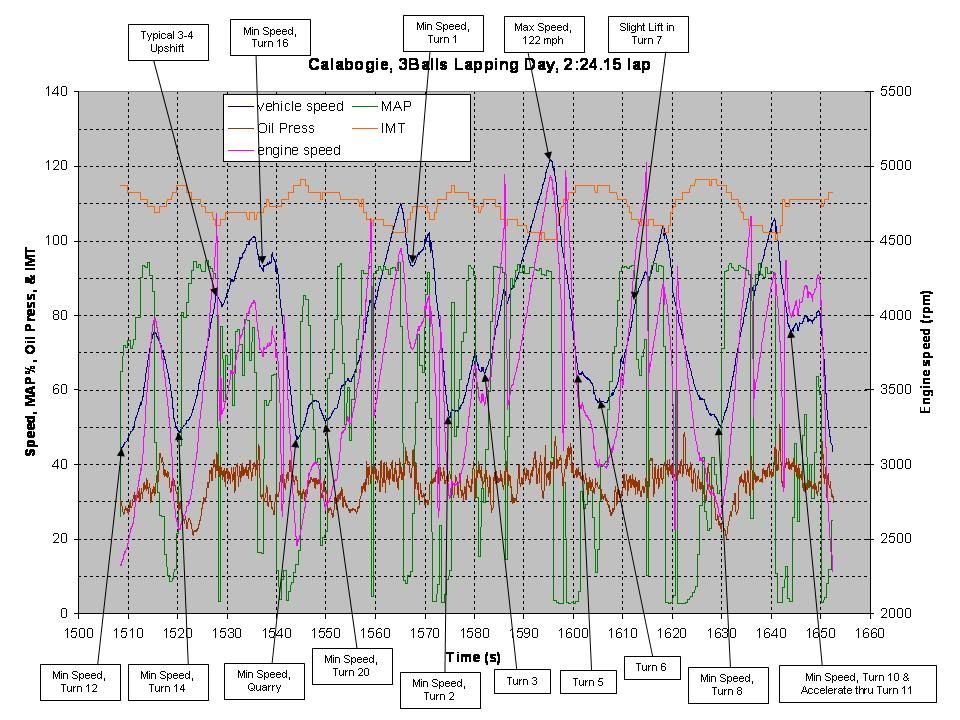
I have been analyzing data from my ECU which was recorded at a track day at Calabogie Motorsports Park last August. Calabogie is a 3.05-mile, 20-turn track which is about 60 miles west of Ottawa in Ontario. I have been going there for 3 years, and always have a blast. On the chart are plots of Vehicle Speed, Engine Speed, Engine Load (%MAP), Intake Manifold Temperature, and Oil Pressure.
Since this is BITOG, I want to draw everybody's attention to the oil pressure trace. It's the noisy brown line in the lower part of the chart. Yes, my engine is running an overall average of 36psi during the lap, varying between a minimum of 21psi and a maximum of 50psi. Sounds pretty scary, doesn't it? The extended drops in pressure are occurring in long left-hand turns, which are Turn 8 and Turn 14.
While I am not an advocate of running high oil pressure, I am uncomfortable with this low amount. I would like to see a nice stable maximum of 55-60psi, with dropoff in the turns no lower than 30. On the other hand, I have been running the car this way for 15 years, and it hasn't expired yet.
I welcome questions, comments, and ideas, and look forward to a lively debate.

