I think that's a great point. Wear numbers are the important result.
You are using an out of date browser. It may not display this or other websites correctly.
You should upgrade or use an alternative browser.
You should upgrade or use an alternative browser.
Valvoline Advanced Synthetic (SynPower) 12K OCI - Ford 2.5L
- Thread starter dogememe
- Start date
- Status
- Not open for further replies.
- Joined
- Sep 26, 2010
- Messages
- 9,807
Originally Posted By: dnewton3
TBN dropped and wear was unaffected in this UOA. There is no correlation between TBN and wear. With no correlation there can be no causation.
Then again, UOAs are not tools for measuring wear; this has been pounded into everyone here ad nauseum. I do understand your point, but wanted to highlight that UOAs are frequently used for measuring wear, when in fact they are for measuring health--of the oil.
Originally Posted By: Gubkin
Originally Posted By: dnewton3
Your observation is flawed
Cummins, MTU and other says that you....
1.0 min limit TBN - [censored]
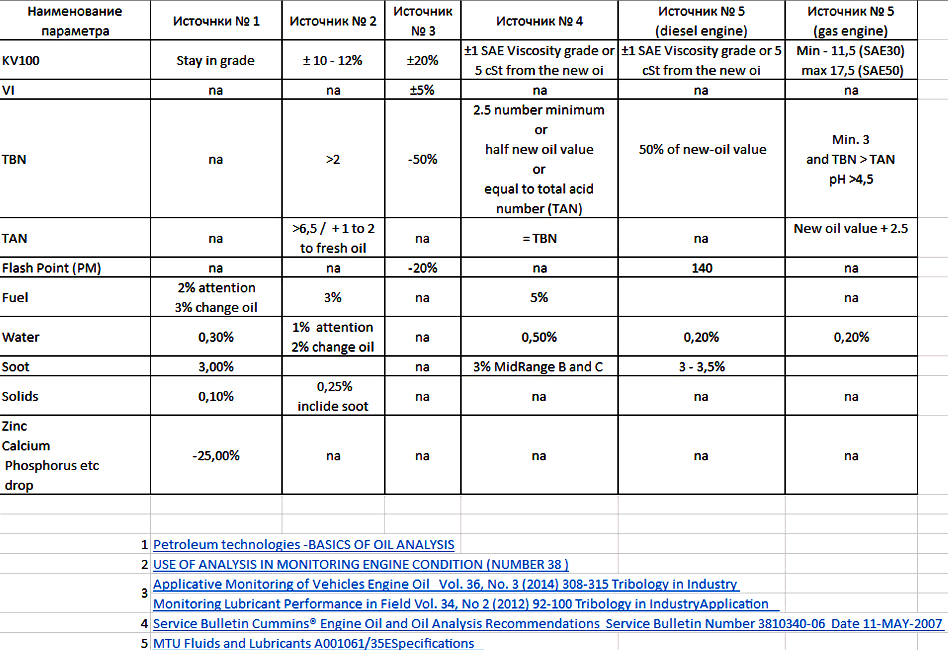
TBN of 1.0 minimum? Fine... and 2.0 is definitely higher than 1.0. Please explain how quickly that 2.0 is going to become 1.0 (or lower) in the usage scenario provided for the engine in this UOA.
...this, of course, notwithstanding dnewton's very well stated argument regarding whether or not the TBN is even a factor. I agree with him 100%, but I'd like to know how 2.0 is "too low" when 1.0 has been provided as the condemnation limit.
Originally Posted By: dnewton3
Your observation is flawed
Cummins, MTU and other says that you....
1.0 min limit TBN - [censored]
TBN of 1.0 minimum? Fine... and 2.0 is definitely higher than 1.0. Please explain how quickly that 2.0 is going to become 1.0 (or lower) in the usage scenario provided for the engine in this UOA.
...this, of course, notwithstanding dnewton's very well stated argument regarding whether or not the TBN is even a factor. I agree with him 100%, but I'd like to know how 2.0 is "too low" when 1.0 has been provided as the condemnation limit.
dnewton3
Staff member
Originally Posted By: 2015_PSD
Originally Posted By: dnewton3
TBN dropped and wear was unaffected in this UOA. There is no correlation between TBN and wear. With no correlation there can be no causation.
Then again, UOAs are not tools for measuring wear; this has been pounded into everyone here ad nauseum. I do understand your point, but wanted to highlight that UOAs are frequently used for measuring wear, when in fact they are for measuring health--of the oil.
I disagree.
UOAs most certainly can measure wear. They are not perfect, but they are a tool that is (by far) the least expensive and timely method we have to assess wear. UOAs are a direct view of lubes and an indirect view of equipment. But they surely do track wear.
Will a UOA find all wear? Nope. The UOA is limited to wear within it's visual spectrum (up to about 5um). But BIG wear (catasrophic wear) is typically acute in nature; it happens fast. A UOA won't always find that because the damage from acute big issues will happen far faster than an OCI/UOA would take place. It can do so at times, but it won't always do so. Blackstone has many of their monthly articles that show how UOAs can catch things and help diagnose issues prior to total engine failure. So that is a topic that really isn't usable for this conversation.
Chronic, slow wear trends most certainly can be tracked with UOAs. This kind of data develops at a pace we can easily track. Also, UOA data based on smaller wear particles has been shown to track in correlation with PC data; several SAE studies show this. ZEE and I have discussed this many times.
There are other methods of measuring wear, but they have their pitfalls as well:
- We could do an engine tear-down; use micrometers and such to measure all things like bearing clearances and journals, bores, etc. But .... this is SUPER DUPER COSTLY in both money and downtime. And, even more detrimental is the fact that gauge R&R data on this type of "wear measurement" is very poor. Plus every time you would presumably reassemble the engine, you also induce issues like new fasteners and related torque that would again affect clearances. No - this type of "wear measurement" really isn't as trustworthy as folks think.
- We could do engine tear-downs, and then use electron bombardment measurements. These have better gauge R&R scores, but again, who's got the time/money to tear down an engine to measure wear? And you still risk inducing issues upon reassembly.
Further, there are SAE studies we've all discussed that show correlation (very good correlation) between the particulate counts in the lube and filters, and the UOA wear metal data. The Ford/Conoco study I've spoken of also shows correlation of wear data and physical measurements. Also, the infamous GM filter study (one I abhor for other reasons) also shows correlation between PC and UOA wear data.
I've never said UOAs are perfect; they are not. But they are absolutely the most efficient, quick means to tracks typical wear patterns. They are reasonably accurate and no more prone to errors than other methods.
Plus, were we to accept the theory that UOAs don't tell us about wear, then why do UOAs ever? I realize most would say "track the lube health". OK - to what goal? How does one know that lube characteristic X makes for more or less wear? Or that lube characteristic Y controls cleanliness? It's all theory of inputs. Unless you can track an output, it's all 100% gibberish. Let me make an analogy; I'm famous for them. But sometimes we have to take our self out of the lube world to think without prejudice.
Consider a basketball game. We collect stats on players ... points per game, rebounds per game, assists per game, etc.
Would you watch a game where there was no score kept and not know who won?
The "score" is an output.
The "stats" are inputs.
Just because a team (or individual player) has better "stats", does not mean they automatically win a game.
In theory, you'd never have to actually play a game; you'd just look at inputs and predict (actually deem) a winner by input data.
But we all know that this isn't a totally accurate way to "play" a game. We all know that small nuances shift things; things we cannot always see or track. Or, that inputs, despite their superior nature, don't always generate a guarantee of success. It's good and useful to use predictors, but the game will always show us that inputs are not always what they seem. Most importantly, inputs that do NOT show correlation to an output are proof that they are moot. A player that has a high average of PPG and RPG does not assure us that his team will win. The important thing to discover, if present, is any correlation between the inputs and outputs. If so, it's a good predictor. If not, it's not useful. Correlation must be present for causation to be possible. Correlation does not assure causation, but causation cannot exist without correlation.
Going back to lubes, this UOA (and most others) clearly shows that TBN is a moot topic for moderate OCIs, out to 15k miles. It may or may not have affect after that, but 15k miles is where most of my data stops; I cannot comment on data I don't have any great accumulation of. I have sporadic data past 15k miles. I do have data from greatly extended OCIs, but those typically also involve BP filters, and that induces an input that is not part of this discussion, so it's not relevant.
There are SAE studies that show vis changing, but wear rates stay low. As long as the vis is not GROSSLY out of spec, it' really does not matter. UOAs show us this too. And the same can be said for TBN. I see no correlation whatsoever that TBN has an effect on wear rates.
The reality is that inputs are nothing more than predictors, not matter what the topic. The only way to know for sure what ACTUALLY happened is to measure an output.
So, you can track vis, TBN, FP, etc all you want; feel free. But if you cannot tie those criteria to an output, it's worthless information.
I'll track the end result, thank you.
Without any doubt, UOAs can most certainly track wear data that is useful, inexpensive, and timely as a means of practical application.
Last edited:
- Joined
- Sep 26, 2010
- Messages
- 9,807
Originally Posted By: dnewton3
Originally Posted By: 2015_PSD
Originally Posted By: dnewton3
TBN dropped and wear was unaffected in this UOA. There is no correlation between TBN and wear. With no correlation there can be no causation.
Then again, UOAs are not tools for measuring wear; this has been pounded into everyone here ad nauseum. I do understand your point, but wanted to highlight that UOAs are frequently used for measuring wear, when in fact they are for measuring health--of the oil.
[...]UOAs most certainly can measure wear.[...]
Remind me again how many UOAs that you stated have to be performed to have a basis for any real data. I could search for it, but I know that you know what that is. I seem to recall after my 2010 FX4 UOA "experiment" that you noted I had not proved or disproved anything due to the changes of oil brands/types and not having enough UOAs to establish trends.
If memory serves, it was 75 or so? If that is true, then using UOAs from various engines/driving styles/oil brands and types/oil filters and types to determine wear (which I know has been stated by many here is not possible--potentially even yourself), seems very unreliable considering all of the variables. I am not trying to slam you in any way, but why (after seeing it posted so many times here) are UOAs now a viable wear measuring tool--IF that is what you are saying? This is not to mention the number of examples where an UOA showed nothing over a long period of time and the engine still fails.
Clarity please.
dnewton3
Staff member
For micro data analysis, you need 30 samples minimum.
For macro data analysis, you only need one for comparative purposes, because the other 29 (or more) are coming from other sources.
To know trends in micro analysis, you have to have 30 samples for each "variable" you manipulate, plus a series of 30 for baseline. This is why UOAs just cannot be easily done in a micro sense. Most all of us simply don't accumulate enough miles in any sense of a timely manner to achieve this. But macro analysis takes into account all the outside influences and melds them into the standard deviation; all the "yabuts" (yeah, but ... ) are accounted for. The difference is in the type of information you seek.
If you want to know how one system works with one lube, you have to do a micro study. Then, if you want to compare/contrast that data to another lube choice, another 30 samples is due. As you can imagine, very time consuming. But if you simply want to know how your system/lube stacks up to others, it's easy to take a snapshot of your singular data (one UOA) and ramp that up against the mass population (other people's UOAs), because there's always well more than 30 of those already available (hundreds if not thousands). But, to be clear, I am NOT referring to looking at one single UOA of yours and one single UOA of mine, then trying to determine which is "better". Rather, I am talking about taking your one UOA and stacking it against the larger population of users (the macro view), whom present 30 or more samples AS A COLLECTIVE WHOLE AND NOT SINGULAR POINTS. When we use macro data, from a large variety of sources, the stdev is typically larger, but that accounts for all manner of inputs (grade choices, location/environment, brands, use factors, etc). We don't have to delineate it further, as the natural variation of inputs is already included.
To address your specific question regarding variation, it's part of the stdev already; we don't have to worry about or discount variation of inputs as they already exist. If you go back and read my "normalcy" study, look at the 500+ UOAs I had for the 4.6L Ford engines. Those samples (sourced from Blackstone) came from Grand Marquis, CVPIs, Mustangs, trucks in just about every corner of North America. As you can imagine, there were daily drivers, severe use, hot rods, cream-puff rides, etc. There were units in steamy FL, desert dry AZ, cold-as-heck MN, soggy Seattle, etc. There were city drivers, highway cruisers, soccer moms and grandma grocery runs. There were 5w-20, 5w-30, 10w-30, 15w-40, 10w-40 grades of lube all used in those engines. All different brands and base stocks, too. ALL MANNER OF INPUT VARIATION already exists in macro data, therefore the standard deviation (sigma node) already accounts for all the differences of life. So when we compare/contrast our own personal single UOA to those of all others, we don't have to make a separate accommodation for "use/grade/base stock/etc ..." Does that help clarify the topic? Hope so; if not let me know and I'll try a different approach.
For example, when you had several UOAs on your old F150, there was no ability to accurately define a sigma (stdev) due to a lack of quantifiable samples (less than 30); you had no real manner to determine which oil was "best" for your situation because you had tried a few different ones in your total series, so any one lube had well less than 30 samples. But, your UOAs can be pared against others in macro analysis; we can look at how your engine/lube combinations did against others within the same engine series (5.4L as I recall). Your UOA series certainly did prove a few things ... Your engine was in great shape, your lube choices performed well, etc. But what they didn't prove (because of less than 30 samples each) is what lube was "better" than another.
Micro analysis can be used to really delineate specific choices within our own application; it's unique to our garage. Macro data allows us to look at our position relative to others from outside our garage.
We always need a MINIMUM of 30 samples for any method of statistical analysis. Micro data is hard to achieve in UOAs. Macro data is easy; no problem finding 30+ samples from all manner of similar equipment (engine, tranny, diff, whatever ....).
NOTE: statistical "analysis" is predicated on using (measuring) actual results, whereas statistical "modeling" is predicated on math formulas with far fewer samples and uses estimated "confidence intervals", etc. While I have training in both, I prefer "analysis" because it deals with real world events that actually happened, and not predictions on what might likely happen. There are many situations where both have their pros/cons; too deep a discussion to have here on BITOG.
PS - I didn't take it as a slam; you and I have been both in agreement and disagreement many times before, but I always find you open, honest, and without personal bias; good traits for debate.
Last edited:
- Joined
- Sep 26, 2010
- Messages
- 9,807
Originally Posted By: dnewton3
[...]For micro data analysis, you need 30 samples minimum. For macro data analysis, you only need one for comparative purposes, because the other 29 (or more) are coming from other sources.[...]
Dave - thanks for taking the time to detail; much appreciated and clarity provided!
[...]For micro data analysis, you need 30 samples minimum. For macro data analysis, you only need one for comparative purposes, because the other 29 (or more) are coming from other sources.[...]
Dave - thanks for taking the time to detail; much appreciated and clarity provided!
Yea but 30 UOA @ say 10,000 miles a piece = 300,000 miles of use just to establish a trend??? Who here keeps a vehicle THAT LONG? I certainly don't. I get tired and want something new by 200k miles at a minimum.
This is why using a Lab like Blackstone with their universal average data helps to compare your data with the dozens, hundreds, if not thousands of UOA they have on a similar engine. I think that's good enough for the average Joe to help find a suitable OCI interval.
This is why using a Lab like Blackstone with their universal average data helps to compare your data with the dozens, hundreds, if not thousands of UOA they have on a similar engine. I think that's good enough for the average Joe to help find a suitable OCI interval.
dnewton3
Staff member
The world of statistical analysis and statistical modeling is way too vast for me to try and hold a seminar here on the inter-webbie.
But, I can at least shine some light onto this at least in a cursory manner.
I am going to discuss statistical analysis; crunching data from real world collection. Statistical modeling takes only a few samples and then predicts possible outcomes. I have training in both, but I prefer analysis for things like UOAs because we have a huge repository of data to use, so why not analyze real world numbers rather than model a guesstimate? The upside to modeling is that (when samples are few and far between, (or samples are uber costly to generate) modeling can be reasonably inexpensive because it uses far fewer samples to generate data. The downside to modeling is that if you choose the wrong confidence interval (CI) or leave things out (on purpose or by accident) that affect the real nature of the subject interaction, you can get a wildly bad data set. The upside to analysis is that it's based on true, historical performance, so "reality" is truly "real world" experiences. Downside to analysis is that it can consume an inordinate amount of time and money because it requires large data sets.
For UOA data, it's real world, and it's paid for by each individual, so "micro" take a long time and costs a lot, but "macro" data comes from a whole host of folks, so it comes quick and its "per person" cost is very low overall. This is why I use UOA macro data; it's real, it's cheap, it's quick; it's accurate.
I will start here ...
In this image below, you see two axis; the X is samples and the Y is a representation of the value of one standard deviation, expressed as a percentage. It's important to note that the Y axis is NOT a quantifiable magnitude, but rather a concept of the presumed real value of your sigma expression.
As you can see, with low sample quantities, the value of your standard deviation (aka stdev, sigma, node) can vary WIDELY. At 10 samples, the "real" value of your stdev could be anywhere from .7 all the way up to 1.8. IOW, there is a huge amount of variation unknown because even at 95% confidence interval, you don't have enough data to accurately define the amount of variation in the process you study. As you get to 30 samples, it's at least reasonable. At 50 samples, it's about as good as it needs to be for most things, and adding more samples really does not gain much accuracy. Past 100 samples, the change is accuracy is nearly moot; the lines would converge at infinity, but who needs that???? No one.

For more clarity, let's put some numbers to this to make sense.
If the "real" (true) stdev was 2.5 in magnitude, consider if you only took 10 samples, the mathematical range for your calculated stdev would be anywhere from 1.75 to 4.5. But at 30 samples it would be much tighter; 2.0 to 3.25. More samples? Even tighter. These numbers are only true for this CI at 95%. If we chose a higher CI, the range would narrow further. If we choose a lower CI, the graph would ever broaden in disparity.
This is why 30 samples is a minimum needed to do ANY analysis decently. Doing only a few samples will easily tell you an average value, but it will tell you nothing credible about the amount of natural variation in the process being studied.
**************************************************************************************
That all in mind, we can now look at the differences of micro vs. macro data.
Review this image:

This chart represents data for Fe samples where the OCIs were 7.5k miles.
The color coding represents different vehicles.
The x axis in the graph is sample and the y axis is Fe ppm.
Micro column represents 30 samples from one subject vehicle.
Macro column represent 3 samples from the one subject vehicle, plus 27 others.
Now look at the Fe average and stdev.
See how the average Fe is very similar between the two, but the stdev is wider in the macro study?
The reason the stdev is wider for the macro group is because they represent a much more diverse use; different grades, brands, viscosity, severity factors, temps of operation, etc. ALL manner of daily life variation across our continent is represented in the "macro" data, because it comes from many different sources. When you use macro data, you don't have to make adjustments for "other" influences; they are already included in the data! Those that object to seeing their UOA compared/contrasted to macro data have no idea of why their objection is moot! When I look at UOA data from macro sources (remember ... I have about 15k UOAs in my database now, and I have access to Blackstone's entire catalog file as we still collaborate from time to time), I can tell you with great certainty how much variation there is across the "real world". Alaska or Arizona, steamy FL or dry SD, towing a 15k pound RV or driving light, city or highway, short trips or long hauls, it's all in there!
When I look at UOA data, using my thousands of UOAs, I can look at an engine/tranny/diff/gearbox and I have a VERY good idea what the stdev truly is, because often I will have 100 or more UOAs (sometimes up to 600 UOAs) for any given application. Don't misunderstand me; I don't have UOAs for every vehicle under the sun because there are too many to track and/or many I just don't care about. I don't have data on Chinese cars, old Yogos, Argentinian trucks .... I track mainstream vehicles in North America.
What we can do, using macro analysis, is compare/contrast your one or two UOAs to the mass population. We can know what is "normal" for nearly anyone. At this point, I recommend you go read (or re-read) my Normalcy article.
https://www.bobistheoilguy.com/used-oil-analysis-how-to-decide-what-is-normal/
The difference between micro and macro data is that you don't have to spend a lot of time and money if you use macro data. You will have a wider variation expectation, but that's totally OK.
Looking at the chart above, see how the "UL" (upper limit) changes with the stdev? Broader inputs will result in broader expectations. But that is totally normal and represents real world life.
If you want to know how well your personal single vehicle runs on a particular lube, you will have to run 30 UOAs. And if you want to compare/contrast that one lube to a different lube, you have to run another 30 UOAs. At 5k miles per UOA, and 60 samples, you're up to 300k miles of experimentation! That is why micro data analysis is not really practical for Joe Bitog. But ...
You can look at your UOA against many others, and see how "normal" your situation truly is.
Anytime your results come back within three stdev, then your results are totally "normal"; they are within the expected variation of the study group and process. Anytime something is "normal", it is improbable (if not impossible) to determine which product would be "better" or "best", because the normal variation will make all experiences bounce over time. Most of the time, our members UOAs here are often within one or two stdev's, and so they are not only "normal", but actually centered quite close to average and very well "controlled".
This is why I tell folks whom post only a few UOAs of their own, that they cannot pronounce a "best" lube brand/grade/base-stock. They just don't have enough data to know with any certainty. There is so much variation with low sample quantities that it's foolish to do so. But, when you take your data and review it against others from large sample quantities, you have a very good idea how your data stacks up to "real world" info. And, as I've proven many times, outputs are far more important than inputs. Between my Dmax UOAs and my MGM UOAs, I've shown that most of the time, synthetics and grades are moot for any moderate OCI duration. Macro data often cannot allow us to conclude that one lube is better than another, but it most certainly help us show that neither lube is typically better than another. When all test subjects return "normal" results, then the input conditions (syn vs dino, thick vs thin) don't have much effect. If macro data shows there is no correlation between use and trends, then causation cannot be present. It is impossible to have causation if no correlation exists!
It is totally possible for any BITOGer to actually find out if Mobil 1 is "better" than Amsoil, or if 5w-30 is "better" than 5w-20. All it takes is 300k miles and a LOT of $$$$$. But since most of us just cannot do that, we must rely on macro data to determine normalcy bounds. If you pay close attention to what I state many times, I pick on folks who make unfounded, unproven claims. I often ask them to PROVE their assertions with real data. I don't give one single hoot of care about inputs; don't talk to me about vis, grade, base-stock, etc. Don't inform me about how much Ca or Mg or Phos is in the bottle; it is impossible for me to care less. What I care about, what I spend my time on, is what actually comes out of the crankcase. What I have learned over many years is based on real world data from folks like all of us, all over North America. Every one of you and others that pay for UOAs help me decide what is "normal". Thank you! And in return, I offer my data analysis as proof of what I claim:
As long as your UOAs are within "normal" bounds, your lube did no better or worse than any other lube that also exists in those same bounds.
Again - UOAs are not perfect; they are a tool that has benefits and limitations. But so do other methods of measuring "wear". UOAs, however, are cheap, quick, and easily studied. When the equipment is in good operating condition, they are an excellent means of tracking "normal" wear trends. And, as I said before, there is good correlation between UOA wear data, and other methods such as electron bombardment, component weight, etc. UOAs are not perfect, but they are not as flawed as some think.
Hope this clears things up.
Class dismissed!

But, I can at least shine some light onto this at least in a cursory manner.
I am going to discuss statistical analysis; crunching data from real world collection. Statistical modeling takes only a few samples and then predicts possible outcomes. I have training in both, but I prefer analysis for things like UOAs because we have a huge repository of data to use, so why not analyze real world numbers rather than model a guesstimate? The upside to modeling is that (when samples are few and far between, (or samples are uber costly to generate) modeling can be reasonably inexpensive because it uses far fewer samples to generate data. The downside to modeling is that if you choose the wrong confidence interval (CI) or leave things out (on purpose or by accident) that affect the real nature of the subject interaction, you can get a wildly bad data set. The upside to analysis is that it's based on true, historical performance, so "reality" is truly "real world" experiences. Downside to analysis is that it can consume an inordinate amount of time and money because it requires large data sets.
For UOA data, it's real world, and it's paid for by each individual, so "micro" take a long time and costs a lot, but "macro" data comes from a whole host of folks, so it comes quick and its "per person" cost is very low overall. This is why I use UOA macro data; it's real, it's cheap, it's quick; it's accurate.
I will start here ...
In this image below, you see two axis; the X is samples and the Y is a representation of the value of one standard deviation, expressed as a percentage. It's important to note that the Y axis is NOT a quantifiable magnitude, but rather a concept of the presumed real value of your sigma expression.
As you can see, with low sample quantities, the value of your standard deviation (aka stdev, sigma, node) can vary WIDELY. At 10 samples, the "real" value of your stdev could be anywhere from .7 all the way up to 1.8. IOW, there is a huge amount of variation unknown because even at 95% confidence interval, you don't have enough data to accurately define the amount of variation in the process you study. As you get to 30 samples, it's at least reasonable. At 50 samples, it's about as good as it needs to be for most things, and adding more samples really does not gain much accuracy. Past 100 samples, the change is accuracy is nearly moot; the lines would converge at infinity, but who needs that???? No one.
For more clarity, let's put some numbers to this to make sense.
If the "real" (true) stdev was 2.5 in magnitude, consider if you only took 10 samples, the mathematical range for your calculated stdev would be anywhere from 1.75 to 4.5. But at 30 samples it would be much tighter; 2.0 to 3.25. More samples? Even tighter. These numbers are only true for this CI at 95%. If we chose a higher CI, the range would narrow further. If we choose a lower CI, the graph would ever broaden in disparity.
This is why 30 samples is a minimum needed to do ANY analysis decently. Doing only a few samples will easily tell you an average value, but it will tell you nothing credible about the amount of natural variation in the process being studied.
**************************************************************************************
That all in mind, we can now look at the differences of micro vs. macro data.
Review this image:
This chart represents data for Fe samples where the OCIs were 7.5k miles.
The color coding represents different vehicles.
The x axis in the graph is sample and the y axis is Fe ppm.
Micro column represents 30 samples from one subject vehicle.
Macro column represent 3 samples from the one subject vehicle, plus 27 others.
Now look at the Fe average and stdev.
See how the average Fe is very similar between the two, but the stdev is wider in the macro study?
The reason the stdev is wider for the macro group is because they represent a much more diverse use; different grades, brands, viscosity, severity factors, temps of operation, etc. ALL manner of daily life variation across our continent is represented in the "macro" data, because it comes from many different sources. When you use macro data, you don't have to make adjustments for "other" influences; they are already included in the data! Those that object to seeing their UOA compared/contrasted to macro data have no idea of why their objection is moot! When I look at UOA data from macro sources (remember ... I have about 15k UOAs in my database now, and I have access to Blackstone's entire catalog file as we still collaborate from time to time), I can tell you with great certainty how much variation there is across the "real world". Alaska or Arizona, steamy FL or dry SD, towing a 15k pound RV or driving light, city or highway, short trips or long hauls, it's all in there!
When I look at UOA data, using my thousands of UOAs, I can look at an engine/tranny/diff/gearbox and I have a VERY good idea what the stdev truly is, because often I will have 100 or more UOAs (sometimes up to 600 UOAs) for any given application. Don't misunderstand me; I don't have UOAs for every vehicle under the sun because there are too many to track and/or many I just don't care about. I don't have data on Chinese cars, old Yogos, Argentinian trucks .... I track mainstream vehicles in North America.
What we can do, using macro analysis, is compare/contrast your one or two UOAs to the mass population. We can know what is "normal" for nearly anyone. At this point, I recommend you go read (or re-read) my Normalcy article.
https://www.bobistheoilguy.com/used-oil-analysis-how-to-decide-what-is-normal/
The difference between micro and macro data is that you don't have to spend a lot of time and money if you use macro data. You will have a wider variation expectation, but that's totally OK.
Looking at the chart above, see how the "UL" (upper limit) changes with the stdev? Broader inputs will result in broader expectations. But that is totally normal and represents real world life.
If you want to know how well your personal single vehicle runs on a particular lube, you will have to run 30 UOAs. And if you want to compare/contrast that one lube to a different lube, you have to run another 30 UOAs. At 5k miles per UOA, and 60 samples, you're up to 300k miles of experimentation! That is why micro data analysis is not really practical for Joe Bitog. But ...
You can look at your UOA against many others, and see how "normal" your situation truly is.
Anytime your results come back within three stdev, then your results are totally "normal"; they are within the expected variation of the study group and process. Anytime something is "normal", it is improbable (if not impossible) to determine which product would be "better" or "best", because the normal variation will make all experiences bounce over time. Most of the time, our members UOAs here are often within one or two stdev's, and so they are not only "normal", but actually centered quite close to average and very well "controlled".
This is why I tell folks whom post only a few UOAs of their own, that they cannot pronounce a "best" lube brand/grade/base-stock. They just don't have enough data to know with any certainty. There is so much variation with low sample quantities that it's foolish to do so. But, when you take your data and review it against others from large sample quantities, you have a very good idea how your data stacks up to "real world" info. And, as I've proven many times, outputs are far more important than inputs. Between my Dmax UOAs and my MGM UOAs, I've shown that most of the time, synthetics and grades are moot for any moderate OCI duration. Macro data often cannot allow us to conclude that one lube is better than another, but it most certainly help us show that neither lube is typically better than another. When all test subjects return "normal" results, then the input conditions (syn vs dino, thick vs thin) don't have much effect. If macro data shows there is no correlation between use and trends, then causation cannot be present. It is impossible to have causation if no correlation exists!
It is totally possible for any BITOGer to actually find out if Mobil 1 is "better" than Amsoil, or if 5w-30 is "better" than 5w-20. All it takes is 300k miles and a LOT of $$$$$. But since most of us just cannot do that, we must rely on macro data to determine normalcy bounds. If you pay close attention to what I state many times, I pick on folks who make unfounded, unproven claims. I often ask them to PROVE their assertions with real data. I don't give one single hoot of care about inputs; don't talk to me about vis, grade, base-stock, etc. Don't inform me about how much Ca or Mg or Phos is in the bottle; it is impossible for me to care less. What I care about, what I spend my time on, is what actually comes out of the crankcase. What I have learned over many years is based on real world data from folks like all of us, all over North America. Every one of you and others that pay for UOAs help me decide what is "normal". Thank you! And in return, I offer my data analysis as proof of what I claim:
As long as your UOAs are within "normal" bounds, your lube did no better or worse than any other lube that also exists in those same bounds.
Again - UOAs are not perfect; they are a tool that has benefits and limitations. But so do other methods of measuring "wear". UOAs, however, are cheap, quick, and easily studied. When the equipment is in good operating condition, they are an excellent means of tracking "normal" wear trends. And, as I said before, there is good correlation between UOA wear data, and other methods such as electron bombardment, component weight, etc. UOAs are not perfect, but they are not as flawed as some think.
Hope this clears things up.
Class dismissed!
Last edited:
- Joined
- Sep 26, 2010
- Messages
- 9,807
Originally Posted By: dnewton3
Class dismissed!
I have no idea why, but some how when I read this, I see Gene Wilder in "Young Frankenstein" after stabbing himself in the leg with a scapel saying "Class...is...dimissed".
Sorry Dave.

Class dismissed!
I have no idea why, but some how when I read this, I see Gene Wilder in "Young Frankenstein" after stabbing himself in the leg with a scapel saying "Class...is...dimissed".
Sorry Dave.
dnewton3
Staff member
Originally Posted By: 2015_PSD
Originally Posted By: dnewton3
Class dismissed!
I have no idea why, but some how when I read this, I see Gene Wilder in "Young Frankenstein" after stabbing himself in the leg with a scapel saying "Class...is...dimissed".
Sorry Dave.
Never be sorry for a great quip from a Mel Brooks classic!

Originally Posted By: dnewton3
Class dismissed!
I have no idea why, but some how when I read this, I see Gene Wilder in "Young Frankenstein" after stabbing himself in the leg with a scapel saying "Class...is...dimissed".
Sorry Dave.
Never be sorry for a great quip from a Mel Brooks classic!
- Joined
- Sep 26, 2010
- Messages
- 9,807
Originally Posted By: dnewton3
Originally Posted By: 2015_PSD
Originally Posted By: dnewton3
Class dismissed!
I have no idea why, but some how when I read this, I see Gene Wilder in "Young Frankenstein" after stabbing himself in the leg with a scapel saying "Class...is...dimissed".
Sorry Dave.
Never be sorry for a great quip from a Mel Brooks classic!
- Status
- Not open for further replies.
Similar threads
- Replies
- 10
- Views
- 897
- Replies
- 48
- Views
- 5K
- Replies
- 31
- Views
- 874
- Replies
- 6
- Views
- 2K