Math Question for Statisticians or Economists

Status
Not open for further replies.
Joined
Oct 17, 2007
Messages
3,706
Location
utah
I would like to know if is incorrect to express percentages above 100% for a known quantity. My friend says no matter what you cannot ever express anything above 100%. The chart that stated the debate:


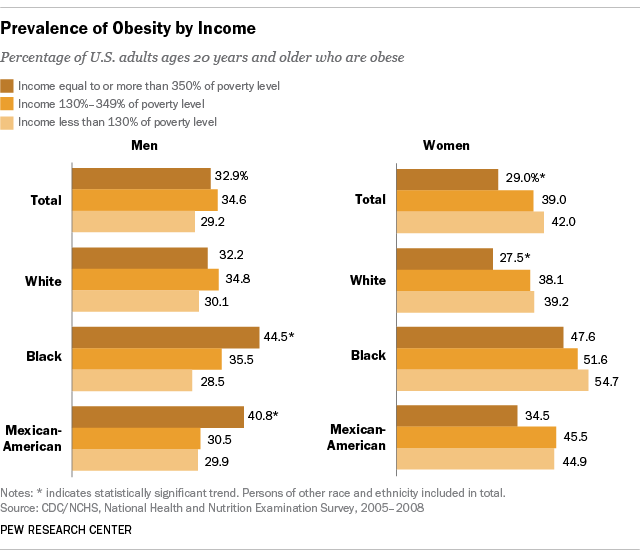
It groups individuals based on their income in relation to federal poverty level. 350% of poverty level to me sounds like 3.5x poverty level, my friend disagrees. He cites his college credit in a statistics class as why he is right and i am wrong. I do no possess college credit for any math courses.

So please, anyone that is well qualified, clear up this little debate for me.

Bonus question: Can you average the three income brackets and offer one obesity statistic for an ethnicity? For example White Men 32.2 + 34.8 + 30.1 divide by 3 = 32.366 % obese.
 
You're correct, 350% of poverty level is 3.5x poverty level.

No, You can't average the 3 income brackets to get a obesity statistic for an ethnicity. For White Men, since the lowest is 30.1 and highest is 34.8 it can be said that more than 30.1 but less than 34.8 are obese.

You can't get above 100% when you count total of something.

Ex: Population in US comprises of 55% White, 22% Hispanic, 15% Black, 7% Asian and 1% other. The total can't be more than 100%, if it does then there are some rounding error.
 
Last edited:
Originally Posted By: HTSS_TR
You're correct, 350% of poverty level is 3.5x poverty level.

No, You can't average the 3 income brackets to get a obesity statistic for an ethnicity.


What he said. If we knew the quantities then we could know the overall % for an ethnic group.
 
The three colors represent the entire group just broken into three subsets based on income level. So all the people in the group are accounted for just separated out according to incomes.

You can't combine and average the subsets into one set of data?
 
Originally Posted By: dareo
The three colors represent the entire group just broken into three subsets based on income level. So all the people in the group are accounted for just separated out according to incomes.

You can't combine and average the subsets into one set of data?


You'd have to know what percentage of the total was in each subset.

For example, two of the groups could contain one individual each and the last group could contain 150,000,000 people...the overall percentage is basically going to be whatever the percentage of the last group was.
 
Can't combine the percentages.

Let's say the highest tier has 100 people in it of whom 32 are obese. Mid tier has 10,000 people who have 3,500 obese and lowest tier has 100,000 of whom 30,000 are obese. So, you have 33,532 people in a population of 110,100 who are obese or 30.5% -- very close to the number in the lowest tier. So you need to have the weight of each tier in order to do a weighted average.
 
No, you can't because you don't know the quantity of each group.

For White Male, assume that 2% of total have 350% or more poverty level, 8% have 130% to 349% poverty level and 90% at poverty level(all these percentage are make up). Then the obesity rate for White Male is (0.9 x 30.1) + (0.08 x 34.8) + (0.02 x 32.2) = 30.518.
 
Actually no. 350% of X is not 3.5X.

If you have $100, then 2X that is $200...or a +100% increase. So if you have $350....that's 250% above the starting amount. It's quite common in business, finances/stock markets, mathematics, engineering, etc. to have >100% of an initial starting value.

You can average those 3 obese white male percentiles but it won't get you anywhere. All it will tell you is what you started with (3 percentiles out of 97.1%).

Some industries twist statistics to suit their own needs. In clothing retail last I checked they can never make 100% on any garmet, even if they sold it for 10X cost....lol. How do they do that? A garmet they paid $10 for and sold for $100, is considered a 90% profit ((100-10)/100). The rest of the world would call that 10X gain a +900% profit.
 
Originally Posted By: 69GTX
Actually no. 350% of X is not 3.5X.

If you have $100, then 2X that is $200...or a +100% increase. So if you have $350....that's 250% above the starting amount. It's quite common in business, finances/stock markets, mathematics, engineering, etc. to have >100% of an initial starting value.


It's of or at, not above or increase in the graphic.
 
Last edited:
Originally Posted By: Alfred_B
It's of or at, not above or increase in the graphic.


Which means what? "X" is the poverty level income. The 3 choices are less than 130% of X, 130-349% of X, and 350% or greater of X. Last I recall the poverty line was around $28K give or take. So that would suggest percentiles of $70K. The amount of white males in each category is "roughly" equal. The slight variation from 32.36% average is pretty small.

I would think that the people at Pew compiling and analyzing such data for the government or whoever they provide it to, took more than just a statistics class in college.
 
Originally Posted By: Alfred_B
Originally Posted By: 69GTX
Actually no. 350% of X is not 3.5X.

If you have $100, then 2X that is $200...or a +100% increase. So if you have $350....that's 250% above the starting amount. It's quite common in business, finances/stock markets, mathematics, engineering, etc. to have >100% of an initial starting value.


It's of or at, not above or increase in the graphic.

Alfred_B is correct.
 
Originally Posted By: HTSS_TR
Originally Posted By: Alfred_B
Originally Posted By: 69GTX
Actually no. 350% of X is not 3.5X.

If you have $100, then 2X that is $200...or a +100% increase. So if you have $350....that's 250% above the starting amount. It's quite common in business, finances/stock markets, mathematics, engineering, etc. to have >100% of an initial starting value.


It's of or at, not above or increase in the graphic.

Alfred_B is correct.


No he's not. "of" or "at" a precise defining line is irrelevant. The exact levels of 130% and 350% are statistical noise given the total population. In fact, there's probably not a single white obese male in the US that made "exactly" 350% of the poverty level income. I only took 4 years and mathematics and graduate level nuclear engineering....I'm no expert in english wars over "of" and "at." I just get the answers.
 
Originally Posted By: CT8
The error seems to be the welfare and lower classes are usually fat.


For black males, the higher income levels have more obesity. Interesting that the black females have just the opposite effect. Similar results for Mexican-Americans. The white males are pretty evenly distributed. Woman's obesity seems to consistently increase as income drops...among all groups. What the study can't tell us is the degree of obesity from group to group.

Considering populations often grow year over year, you start with a 100% and the following year you have more than 100%. There is no other way to do analyze it...unless you want to say this year we have 100% of the population...and last year we only had 98%. That would confuse people.
 
Originally Posted By: 69GTX
No he's not. "of" or "at" a precise defining line is irrelevant. The exact levels of 130% and 350% are statistical noise given the total population. In fact, there's probably not a single white obese male in the US that made "exactly" 350% of the poverty level income. I only took 4 years and mathematics and graduate level nuclear engineering....I'm no expert in english wars over "of" and "at." I just get the answers.

If you read the first few lines of the chart you should see these:

Quote:
Income equal to or more than 350% poverty level.

Income 130%-349% poverty level.

Income less than 130% poverty level.


"Income equal to 350% poverty level" is 3.5 times poverty level.
 
Poverty Level for one single person is $11720 a year. So if someone is at 130% of Poverty Level would that be calculated as 11720 x 1.3 = 15236 and under for the lowest bracket. That is less than $8 an hour full time.

Or for the top bracket 11,720 x 3.5 = 41,020 and higher is dark orange?

To further confuse the data, poverty level is variable based on the family size of the person in the sample group. A 9 person household can make 47,297 and be poverty level. That 9 person household would need to be 165,539.5 per year in income to make that top bracket.
 
Of is a mathematical operator.

350% OF the poverty level is 3.5 times the poverty level.

Someone on 350% OF the poverty level is 250% above the poverty line.

Same as increasing the strength of something BY 10% gives it 110% OF the strength that it had.
 
Originally Posted By: Shannow
Of is a mathematical operator.

350% OF the poverty level is 3.5 times the poverty level.

Someone on 350% OF the poverty level is 250% above the poverty line


I'll buy that. In my professional engineering and financial calculations over the past 45 years, I can't recall this particular usage. Everything I've ever done is related to gains, growth, losses, etc. Well, something I'll be more aware of next time out.

To reiterate the OP's question. Yes, percentages above 100% are fair game...and quite common. Look at largest inflations of the 20th century.

The Post-World War II hyperinflation of Hungary held the record for the most extreme monthly inflation rate ever — 41,900,000,000,000,000% (4.19 × 10¹⁶% or 41.9 quadrillion percent) for July 1946, amounting to prices doubling every 15.3 hours. By comparison, recent figures (as of 14 November 2008) estimate Zimbabwe's annual inflation rate at 89.7 sextillion (1021) percent.,[20] which corresponds to a monthly rate of 79.6 billion percent, and a doubling time of 24.7 hours. In figures, that is 89,700,000,000,000,000,000,000%.
 
Thank you for the clarification. My friend's teacher told him that all statistics above 100% are all wrong. College teachers get it wrong or at least teach it in unclear ways all the time.
 
Status
Not open for further replies.
Back
Top